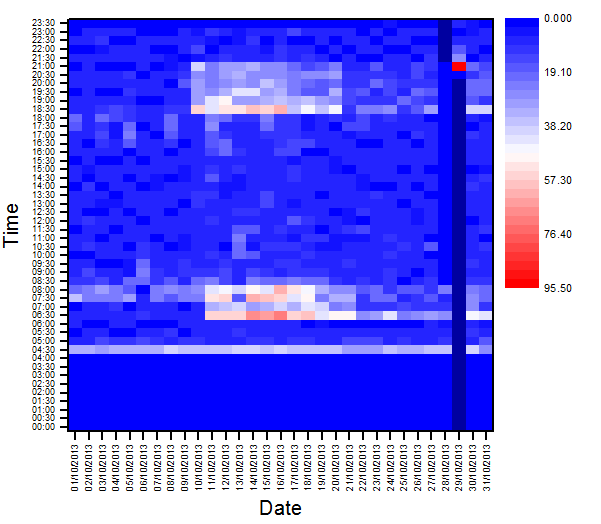
B1 - Heatmap Plot
Download 92DemoGraphing.opj and Try with B1 folder
Menu to plot heatmap is Plot: Contour/Heat Map: Heat Map. Toolbar button can be found in the Contour group of 3D and Contour Graphs toolbar. (XYZ data is not supported yet)
![]()
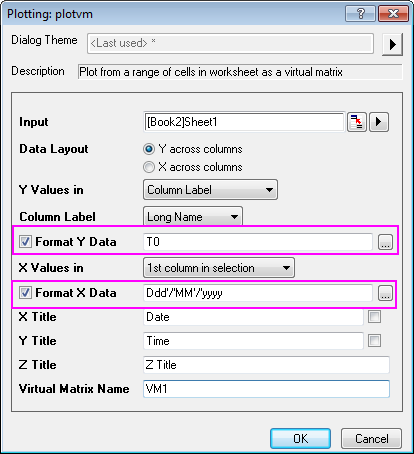
The plotvm dialog to plot heatmap and contour plot with virtual matrix is improved.
- Support date, time data format.for X,Y values.
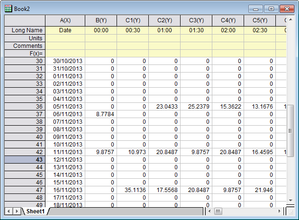
- Support to select a existed virtual matrix from virtual matrix manager to plot a graph. For example, when the following graph is plotted, there will be a virtual matrix named VM1.
Select the worksheet and open the plotvm dialog, click the triangle button after Input, click Select Virtual Matrix... from the fly-out menu, select VM1 from the Virtual Matrix Manager, then click OK to get the same plot.
 |  |
 |
, multiple selections available,